The telecom infrastructure stock witnessed selling pressure after it hit a high of Rs 332 on 28 September 2021. The stock closed at Rs 193 on 23 September 2022 which translates into a downside of nearly 42 per cent.
The stock has been making a lower high and lower low structure since then. It tried to take support above Rs 220-230 levels but that support was also broken in February 2022.
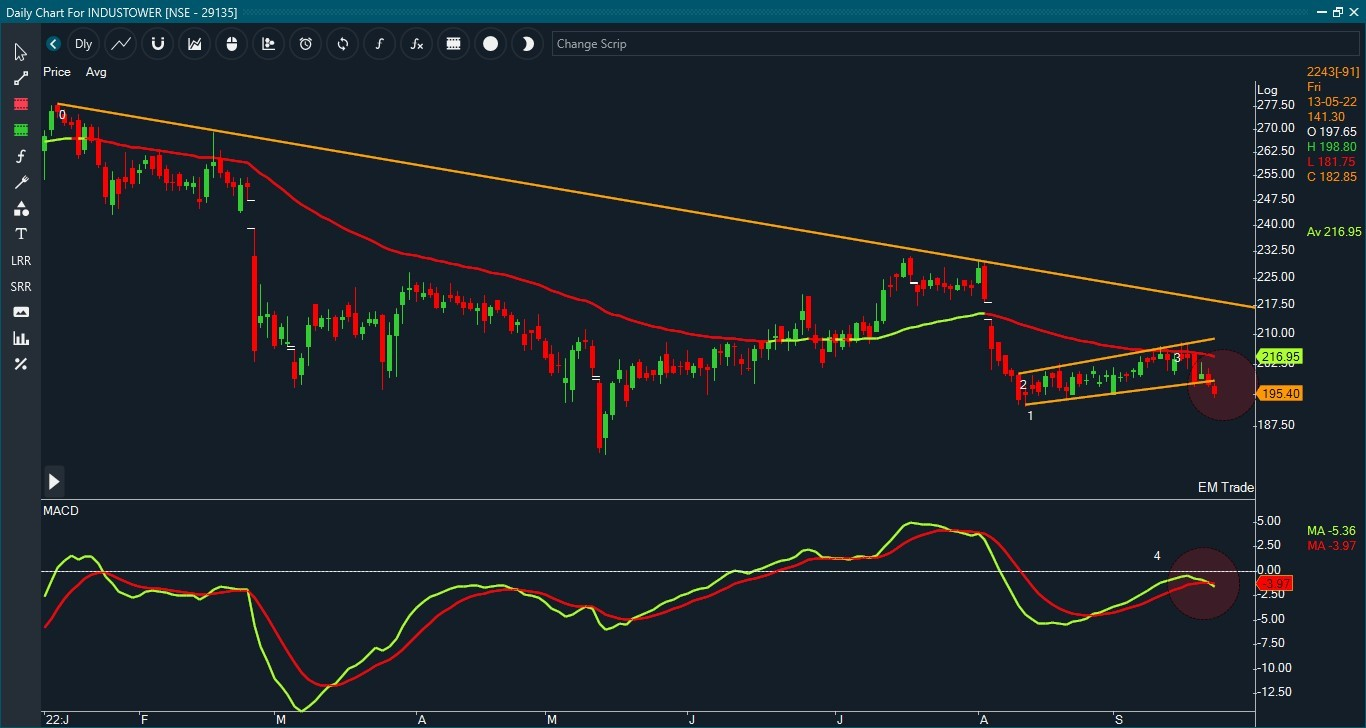
The stock was trading in a narrow range of 10 points since 10 August 2022 but it finally gave a breakdown from the range on 19 September.
The recent price action suggests that weakness is likely to continue in the near term, and traders can go short for the target of Rs 182 which is closer to its 52-week low of Rs 181, suggest experts.

The stock is trading below all its crucial short- and long-term moving averages such as 5,10,30,50,100 and 200-DMA which is a negative sign.
The relative strength index (RSI) is at 33.1. RSI below 30 is considered oversold and above 70 is considered overbought, Trendlyne<\/a> data showed. MACD is below its signal and center line, this is a strong bearish indicator.
The stock has remained an underperformer viz-a-viz to its peers and the broader market. On a higher time frame, stock is under lower high and lower low sequence indicative bearish structure.
“After a couple of week’s relief rallies, the stock has witnessed selling pressure from mid-term falling moving average. Stock has breached the rising channel, which confirms a bearish continuation sign,” Kapil Shah, Technical Analyst<\/a>, Emkay Global Financial Services<\/a> and Trainer- FinLearn Academy<\/a>, said.
“From the oscillator perspective, MACD gave a negative crossover in the negative zone. Price structure and oscillator harping on the same string,” he said.
“Based on the aforementioned rationale, the stock is a short candidate at a CMP of Rs 195 with a stop loss of Rs 202 and downside potential at Rs 182. duration can be of 1 month,” recommends Shah.
(Disclaimer: Recommendations, suggestions, views and opinions given by the experts are their own. These do not represent the views of Economic Times<\/a>)<\/em>
<\/body>","next_sibling":[{"msid":94448230,"title":"With eye on Big Tech, energy crisis, EU telcos call for shared network costs","entity_type":"ARTICLE","link":"\/news\/with-eye-on-big-tech-energy-crisis-eu-telcos-call-for-shared-network-costs\/94448230","category_name":null,"category_name_seo":"telecomnews"}],"related_content":[{"msid":"94447666","title":"Chart Check: 40% fall from Sept 2021 highs, traders can go short in this telecom stock; here\u2019s why","entity_type":"IMAGES","seopath":"markets\/stocks\/news\/chart-check-40-fall-from-sept-2021-highs-traders-can-go-short-in-this-telecom-stock-heres-why","category_name":"Chart Check: 40% fall from Sept 2021 highs, traders can go short in this telecom stock; here\u2019s why","synopsis":false,"thumb":"https:\/\/etimg.etb2bimg.com\/thumb\/img-size-25842\/94447666.cms?width=150&height=112","link":"\/image\/markets\/stocks\/news\/chart-check-40-fall-from-sept-2021-highs-traders-can-go-short-in-this-telecom-stock-heres-why\/94447666"}],"msid":94448449,"entity_type":"ARTICLE","title":"40% fall from Sept 2021 highs, traders can go short in this telecom stock; here\u2019s why","synopsis":"The telecom infrastructure stock witnessed selling pressure after it hit a high of Rs 332 on 28 September 2021. The stock closed at Rs 193 on 23 September 2022 which translates into a downside of nearly 42 per cent.","titleseo":"telecomnews\/chart-check-40-fall-from-sept-2021-highs-traders-can-go-short-in-this-telecom-stock-heres-why","status":"ACTIVE","authors":[{"author_name":"Kshitij Anand","author_link":"\/author\/479257392\/kshitij-anand","author_image":"https:\/\/etimg.etb2bimg.com\/authorthumb\/479257392.cms?width=100&height=100&hostid=268","author_additional":{"thumbsize":true,"msid":479257392,"author_name":"Kshitij Anand","author_seo_name":"kshitij-anand","designation":"Editor - Markets and Finance","agency":false}}],"Alttitle":{"minfo":""},"artag":"ETMarkets.com","artdate":"2022-09-26 12:16:05","lastupd":"2022-09-26 12:17:35","breadcrumbTags":["Indus Towers","emkay global financial services","economic times","trendlyne","trainer- finlearn academy","kapil shah, technical analyst","indus towers","Industry","telecom news","Indus Towers share price"],"secinfo":{"seolocation":"telecomnews\/chart-check-40-fall-from-sept-2021-highs-traders-can-go-short-in-this-telecom-stock-heres-why"}}" data-authors="[" kshitij anand"]" data-category-name="" data-category_id="" data-date="2022-09-26" data-index="article_1">
- Telecom乐动扑克News
- 2分钟阅读
从2021年9月高位下跌40%,交易商可以在这个电信的股票;这是为什么
电信基础设施股票后目睹了抛售压力达到一个高的Rs 332年9月28日2021年。Rs 193股票收于2022年9月23日转化为下行的近42%。
印度塔电信基础设施的一部分空间,从52周高点下跌逾40%,当前技术设置表明熊仍然在控制可能会推动股票其52周低点。
电信基础设施股票后目睹了抛售压力达到一个高的Rs 332年9月28日2021年。Rs 193股票收于2022年9月23日转化为下行的近42%。
股票一直在一个较低的高收入和较低的结构。它试图支持Rs 220 - 230年的水平,但高于支持也打破了2022年2月。
股票交易是一个狭窄的范围自2022年8月10日10分,但最后崩溃了从9月19日。
最近的价格走势表明,缺点是在短期内可能会继续,和交易员可以简称Rs 182的目标更接近其52周低点181卢比,建议专家。

股价低于其所有重要的短期和长期移动平均线等5,10,50100和200 - dma负号。
相对强弱指标(RSI)为33.1。RSI低于30被认为是超卖,70以上被认为是超买,Trendlyne数据显示。MACD低于其信号和中心线,这是一个强烈的悲观的指标。
股市一直表现最差viz-a-viz同行和更广泛的市场。在更高的时间框架,股票在较低的高和较低的低序列表明悲观的结构。
“几个星期后触底反弹,中期下跌的股票已经目睹了抛售压力移动平均线。股票已经违反了上升通道,证实是延续利空信号,”Kapil沙,技术分析师,假如全球金融服务和教练——FinLearn学院说。
“从振荡器的角度来看,MACD给消极的负面空间交叉。价格结构和振荡器喋喋不休讨论相同的字符串,”他说。
“基于上述理由,股票是一个短的候选人的CMP Rs 195止损的Rs 202和下行潜在的Rs 182。时间可以是1个月,“建议国王。
(免责声明:建议,建议,观点和意见的专家。这些并不代表的意见经济形势)
电信基础设施股票后目睹了抛售压力达到一个高的Rs 332年9月28日2021年。Rs 193股票收于2022年9月23日转化为下行的近42%。
股票一直在一个较低的高收入和较低的结构。它试图支持Rs 220 - 230年的水平,但高于支持也打破了2022年2月。
股票交易是一个狭窄的范围自2022年8月10日10分,但最后崩溃了从9月19日。
最近的价格走势表明,缺点是在短期内可能会继续,和交易员可以简称Rs 182的目标更接近其52周低点181卢比,建议专家。
股价低于其所有重要的短期和长期移动平均线等5,10,50100和200 - dma负号。
相对强弱指标(RSI)为33.1。RSI低于30被认为是超卖,70以上被认为是超买,Trendlyne数据显示。MACD低于其信号和中心线,这是一个强烈的悲观的指标。
股市一直表现最差viz-a-viz同行和更广泛的市场。在更高的时间框架,股票在较低的高和较低的低序列表明悲观的结构。
“几个星期后触底反弹,中期下跌的股票已经目睹了抛售压力移动平均线。股票已经违反了上升通道,证实是延续利空信号,”Kapil沙,技术分析师,假如全球金融服务和教练——FinLearn学院说。
“从振荡器的角度来看,MACD给消极的负面空间交叉。价格结构和振荡器喋喋不休讨论相同的字符串,”他说。
“基于上述理由,股票是一个短的候选人的CMP Rs 195止损的Rs 202和下行潜在的Rs 182。时间可以是1个月,“建议国王。
(免责声明:建议,建议,观点和意见的专家。这些并不代表的意见经济形势)

评论
现在评论 阅读评论(1)所有评论
找到这个评论进攻?
下面选择你的理由并单击submit按钮。这将提醒我们的版主采取行动