
Limiting my note on consumer products, GfKIndia<\/a> is mentioning an increase in the ASP in 2022 between 4-9% for TVs, appliances and laptops. The fact is that the ASP for all these products has been showing an increasing trend since 2020 – The year of COVID-19. The low and mid segment are on the decline.
Moving on to smartphones, IDC puts the increase in the ASP of smartphones at 18%, which is more than double that of laptops. The reason given here is the growth in the mid-premium segment (Rs 25k – Rs 40k) by 20% and the premium segment (Rs.40k+) by 55%. As per CMR, the uber-premium segment of Rs 100k+ grew by an astounding 95%.
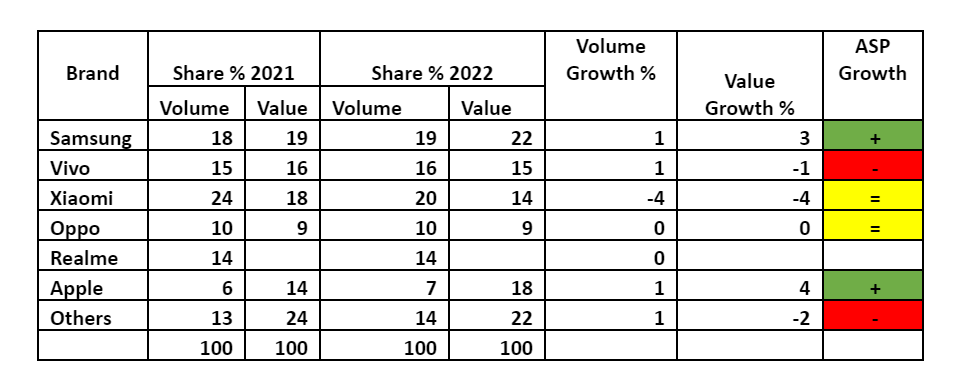
Let us look at the table below based on Counterpoint data, which has the volume and the value contribution for the last 2 years. Since the entire data is in %s, it would be right to conclude the following:
- If the value growth % is higher than the volume growth %, the ASP of the brand has gone up (marked in green).<\/li>
- If value growth % is lower than the volume growth %, the ASP of the brand has gone down (marked in red).<\/li>
- If the value growth % is matched by the volume growth %, the ASP has remained unchanged (marked in Yellow).<\/li><\/ul>
<\/span><\/figcaption><\/figure>
Why did the ASP of most brands not go up? Let us draw some conclusions for brands and the suggested way forward for not all brands could have missed out on the ASP going up in 2022 while planning their GTM – as the ASP had been showing a upward trend in the earlier years as well.- Brands could have consciously avoided the entry and mid-segment because they thought it would be difficult to generate both revenue and profits with the competition. Even in 2023, a decline in the market is forecasted by research agencies unless the JioPhoneNext makes a grand entry and really shakes up the mid-segment.<\/li>
- They did not launch enough devices<\/a> in the mid-premium and premium segment for fear of acceptance and for reasons mentioned above. This is a product portfolio challenge and lack of confidence.<\/li>
- They did launch some but got a tepid response which could mean a product proposition or brand positioning issue.<\/li>
- They continued their play in the mid and higher end devices<\/a> of the sub Rs.25k segment with a target for a reasonable increase in the ASP. However, the segment declined by 15% and their plans failed as they could not get increased volumes.<\/li><\/ul>If not all, at least 4 of the top 5 brands should have shown growth in their ASP to show premiumisation of the smartphone category as a whole. What we see from the chart (shown above) is actually a case of premiumisation of only 2 brands - Apple<\/a> and Samsung<\/a>. Brands like Vivo have actually dropped their ASP. In the case of Xiaomi and Oppo, the ASP has remained unchanged.
Based on the above chart and the fact that the volumes this year are expected to decline, it is imperative for brands to get their ASP up which would mean going after the mid-premium and premium segment. But not all brands will find easy acceptance in these categories from customers.
Samsung<\/a> seems to be having momentum in its favor being a clear No. 1 with a 14% revenue increase in 2022, and now the good response to its GalaxyS23 in 2023. They are following it up with plans of opening up fifteen premium experience stores across nine cities by the end of 2023 from existing two.
Xiaomi managed to hold on to its No. 1 position in volumes last year but the gap between them and Samsung in volumes has come down to just 1%. In value they have been pushed to No. 3. With 3 months of the year already gone it is about time for them to not only push volumes (a decline of 4% is worrying), but also push products in the Rs 25k - Rs. 40k segment if not the Rs 40k+ segment. Of course they can have a flagship product at that price as well for brand positioning in the future. The only good thing could be the fact that it is the only Chinese company that has shown a profit in FY 2020 and 2021. This should give them the resources for the right alignment in their product portfolio, channel strategy, product quality, and service.
A decline of 25% in the segment below Rs 25k would be highly worrying for Vivo and Oppo. If this continues they will have to take away a good share from others like Xiaomi and Realme<\/a> by going down the price ladder to get revenues from volumes through a price war, which will hit their hope of positioning their brand higher. Alternatively, they will have to go up the ladder which would mean competing with well-entrenched brands as well such as Nothing. Getting a positive response from customers who have strong brand loyalties in the mid and premium segments will not be that easy. As a brand moves up the price ladder brand loyalties increase.
This leaves Xiaomi, Vivo, Oppo and Realme<\/a> to play primarily in the mid-premium segment. Brands need to align their product portfolio which exhibits real innovation through R&D, product designing, innovative marketing, superb user experience, both pre and post-purchase of device, with the right channel to make a reasonable presence in this segment in 2023, to take the leap to the premium segment in 2024.
At the same time, brands that may have been hit in the sub-Rs 25k segment should keep their options open in the mass segment as well, as customers may be cautious in their spends due to the global slowdown and its effects. Prices of 5G devices are expected to go down by the second half of 2023 (JioPhoneNext could do it for sure) and 5G is the key driver for sales this year. It should not happen that they land up generating even lower volumes and lower values in 2023 just trying to follow the past trend. The market is very dynamic.
One more interesting thing to find out would be the reasons for the reduction in the replacement cycle of washing machines and refrigerators which are much ahead of smartphones in terms of the product life cycle. It is not just product quality getting better at higher ASPs. There is something else to it that needs to be found and replicated.
<\/body>","next_sibling":[{"msid":99367115,"title":"Auction of satellite spectrum?","entity_type":"ARTICLE","link":"\/blog\/auction-of-satellite-spectrum\/99367115","category_name":null,"category_name_seo":"blog"}],"related_content":[],"msid":99449619,"entity_type":"ARTICLE","title":"Premiumisation: Every brand\u2019s call, but only two\u2019s voice!","synopsis":"\"A decline of 25% in the segment below Rs 25k would be highly worrying for Vivo and Oppo. If this continues they will have to take away a good share from others like Xiaomi and Realme by going down the price ladder to get revenues from volumes through a price war, which will hit their hope of positioning their brand higher,\" says Sharma.","titleseo":"blog\/premiumisation-every-brands-call-but-only-twos-voice","status":"ACTIVE","authors":[{"author_name":"Ajay Sharma","author_link":"\/author\/479260496\/ajay-sharma","author_image":"https:\/\/etimg.etb2bimg.com\/authorthumb\/479260496.cms?width=100&height=100&hostid=268","author_additional":{"thumbsize":true,"msid":479260496,"author_name":"Ajay Sharma","author_seo_name":"ajay-sharma","designation":"Advisor","agency":false}}],"analytics":{"comments":0,"views":645,"shares":0,"engagementtimems":1417000},"Alttitle":{"minfo":""},"artag":"ETTelecom","artdate":"2023-04-13 08:19:57","lastupd":"2023-04-13 08:19:59","breadcrumbTags":["Apple","realme","gfkindia","premium phones","Samsung","iphone","Counterpoint Research","premiumisation trend","smartphone industry","Devices"],"secinfo":{"seolocation":"blog\/premiumisation-every-brands-call-but-only-twos-voice"}}" data-authors="[" ajay sharma"]" data-category-name="" data-category_id="" data-date="2023-04-13" data-index="article_1">- 博客
- 6分钟阅读
Premiumisation:每个品牌的调用,但只有两个的声音!
“段下降25%低于Rs 25 k高度担忧Vivo和相对应的人。如果这继续他们将不得不带走一个好的分享别人的小米和Realme通过更低的价位从卷通过价格战,获得收入将达到他们希望定位自己的品牌高,”Sharma说。


限制我的注意在消费产品,GfKIndia是2022年提到提高ASP在4 - 9%之间电视、电器和笔记本电脑。事实是,所有这些产品的ASP自2020年以来一直表现出日益增长的趋势——COVID-19之年。低和中期段是在下降。
移动智能手机,IDC ASP的智能手机将增加18%,这比笔记本电脑的两倍。这里的理由是mid-premium段的增长(Rs 25 k - Rs 40 k)和20%的溢价部分(Rs.40k +) 55%。根据CMR, uber-premium段Rs 100 k +增长了95%,太令人震惊了。
让我们看看下表基于对比数据,体积和价值贡献在过去的2年。因为整个数据在% s,这将是正确的结论如下:
- 如果该值增长%高于销量增长%,品牌的ASP上升(绿色)。
- 如果价值增长%低于增长%,品牌的ASP下降了(用红色标注)。
- 如果该值增长%匹配的销量增长%,ASP一直保持不变(用黄色标记)。
大多数品牌的ASP为什么不去了?品牌让我们得出一些结论和建议前进的并不是所有的品牌可能会错过了ASP将于2022年在规划他们的GTM - ASP在早些年一直呈现出上升趋势。
- 品牌可以有意识地避免入口端理财业务方面,因为他们认为这很难产生收入和利润的竞争。即使在2023年,市场研究机构预测的下降,除非JioPhoneNext使大条目和真的摇端理财业务方面。
- 他们没有足够的发射设备mid-premium和溢价部分因为害怕接受和上面提到的原因。这是一个产品组合的挑战和缺乏信心。
- 他们推出了一些,但有一个不温不火的反应这可能意味着一个产品定位和品牌定位的问题。
- 他们继续在中期和高端设备子Rs.25k段的一个合理的目标增加ASP。段下降了15%,他们的计划失败了,因为他们无法增加卷。
基于上面的图表,预计今年的销量下降,必须对品牌他们的ASP这意味着mid-premium和溢价部分。但并不是所有的品牌会发现容易接受这些类别的客户。
三星似乎在其支持势头明显1号收入在2022年增长了14%,现在,好应对2023年GalaxyS23。他们是用计划后开放15优质体验店在9个城市从现有两到2023年底。
小米设法保持其去年在卷1号位置,但它们之间的差距和三星在卷下来仅为1%。在他们被推到3号。今年3个月已经不仅仅是关于时间来推卷(令人担忧下降4%),但也推动产品在Rs 25 k - Rs。40 k段如果不是Rs 40 k +段。当然,他们可以有一个旗舰产品,价格和未来品牌定位。唯一的好事可能事实是唯一的中国公司在2020年和2021年财政年度盈利。这应该给他们正确的对齐的资源产品组合、渠道策略,产品质量和服务。
下降25% 25 k将在下面的部分中Rs高度担忧Vivo和相对应的人。如果这继续他们将不得不带走从别人小米和良好的份额Realme通过更低的价位从卷通过价格战,获得收入将达到其定位自己的品牌更高的希望。或者,他们将不得不上梯子这意味着竞争与根深蒂固的品牌等。得到积极回应来自顾客的强大的品牌忠诚在中期和溢价部分将不会那么容易。随着品牌价格阶梯品牌忠诚增加。
这使得小米,体内,同僚和Realme主要在mid-premium段。品牌需要调整其产品组合表现出真正的创新通过研发、产品设计、创新营销、出色的用户体验,pre和售后的设备,通过正确的渠道做一个合理的在这段2023年,在2024年花跳跃溢价部分。
同时,品牌可能是击中sub-Rs 25 k部分应该保留他们的选择权在质量领域,由于客户可能会谨慎的花因全球经济放缓和它的影响。5 g设备价格预计在2023年下半年下降(JioPhoneNext可以肯定)和5克是今年的销量的关键驱动因素。应该不会发生,他们的土地2023年生成更低量和较低的值只是想跟过去的趋势。市场是非常动态。
一个更有趣的发现将是减少的原因更换周期的洗衣机和冰箱之前,智能手机的产品生命周期。不仅仅是产品质量得到更好更高的asp。有别的需要发现和复制。

评论
现在评论 阅读评论(1)所有评论
找到这个评论进攻?
下面选择你的理由并单击submit按钮。这将提醒我们的版主采取行动